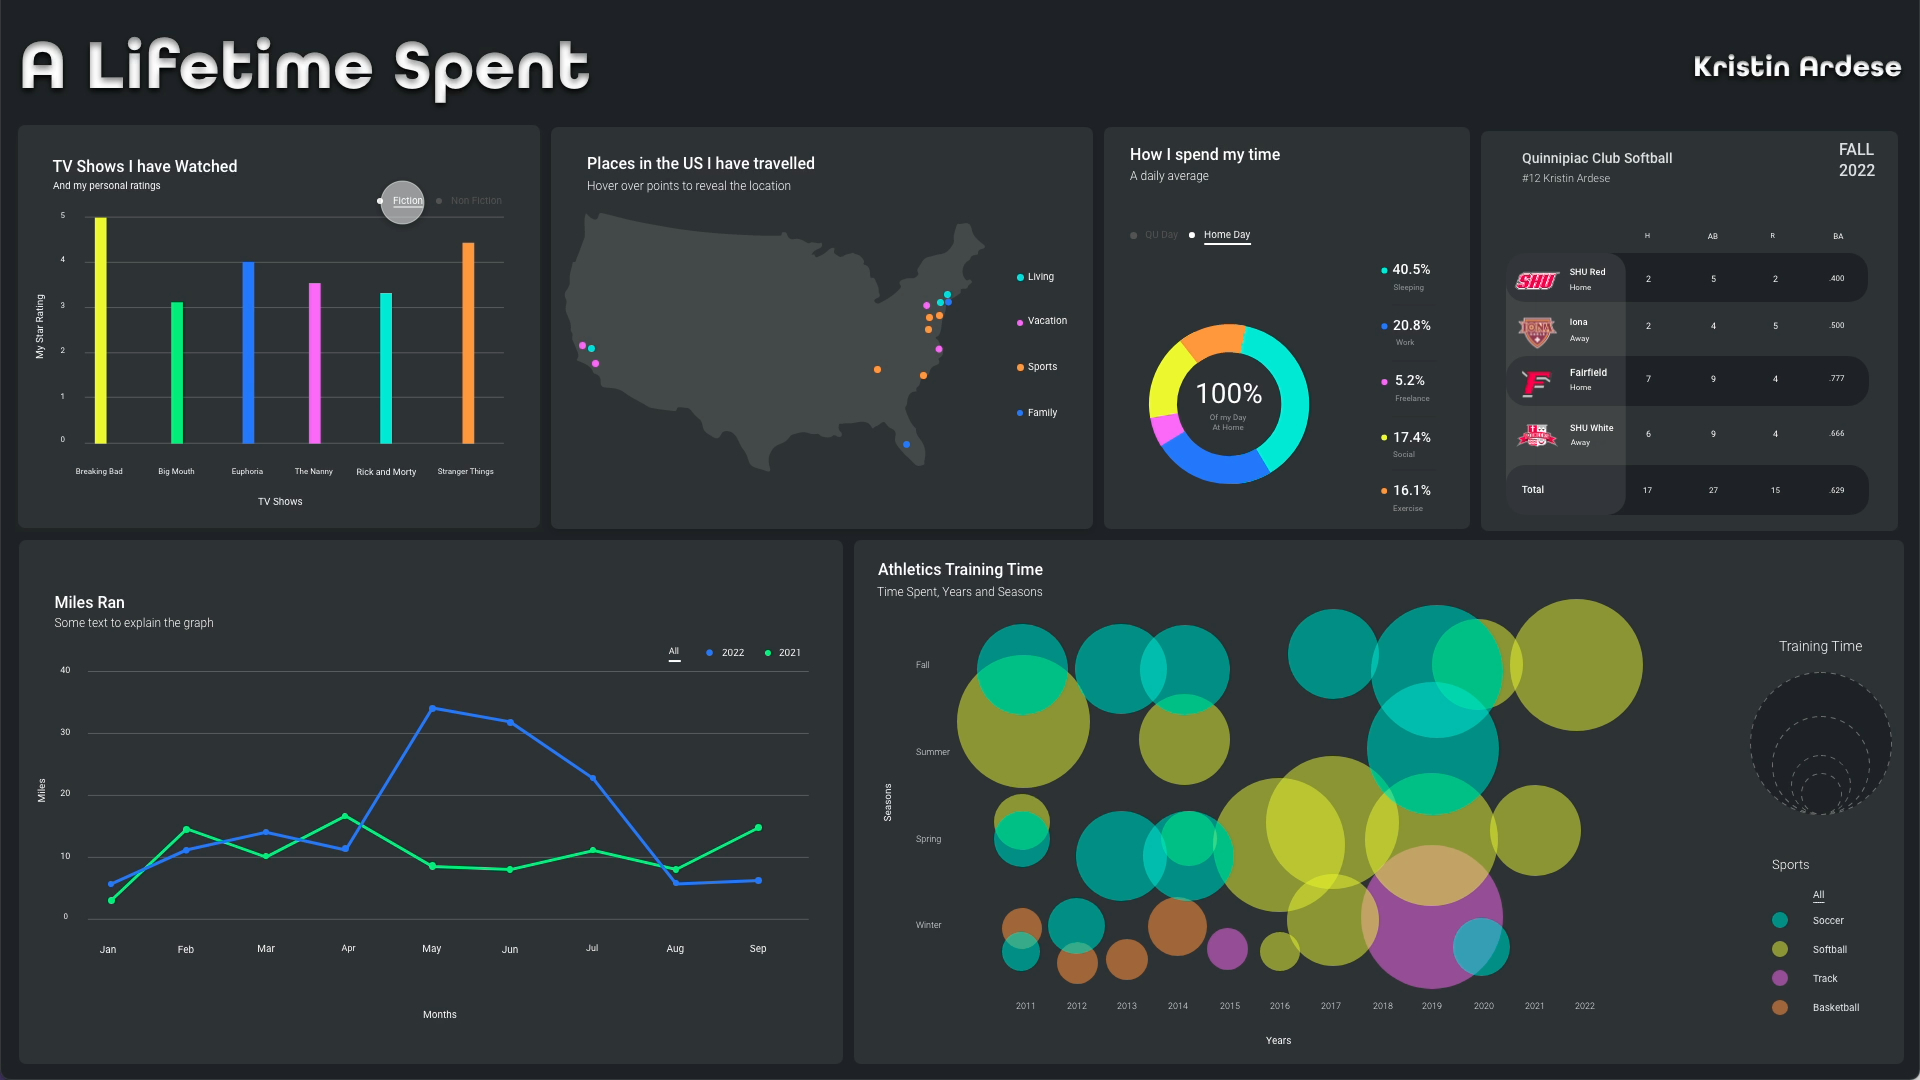
Research a topic of personal interest to collect quantitative data. Select the appropriate data visualizations and design the user interface. Finally, prototype the motion and micro-interactions to show and hide the layers of information.
3. Interactive Projects
Research a topic of personal interest to collect quantitative data. Select the appropriate data visualizations and design the user interface. Finally, prototype the motion and micro-interactions to show and hide the layers of information.

Research five facts from a significant protest event in American history. Design a webpage section for each fact and create a fixed global navigation that links to each section on a one-page website. Resist!
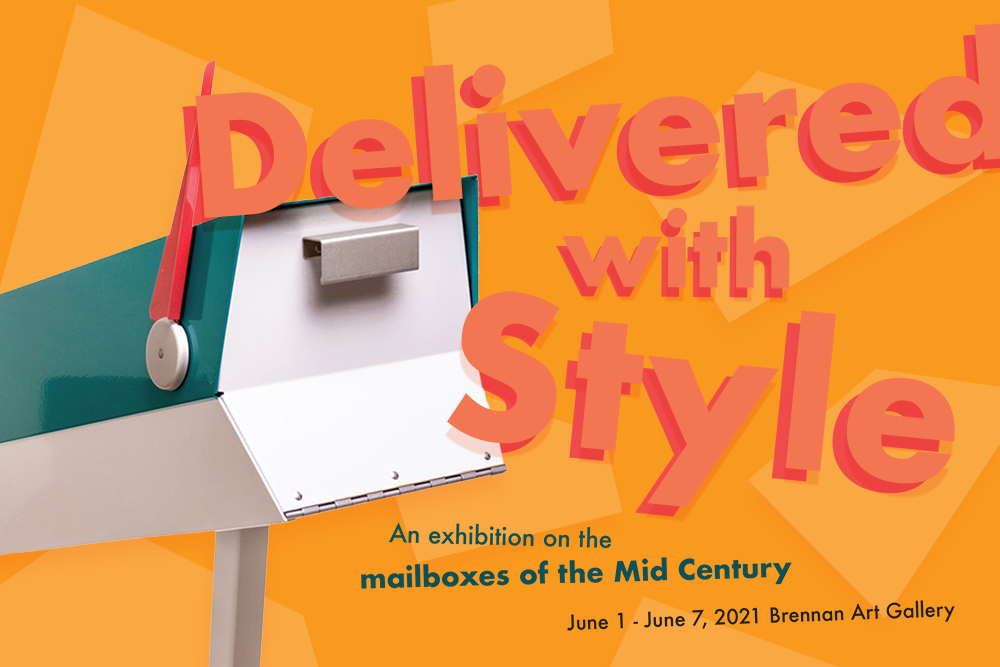
Select an object to be the subject of an exhibition. Write some creative titles and design a poster. Now, let’s level up. The poster is actually a grid of smaller images in an interactive experience, sort of like you might find on Instagram. Design several branching sequences, that start from the individual segments, and reveal additional information about the exhibition.
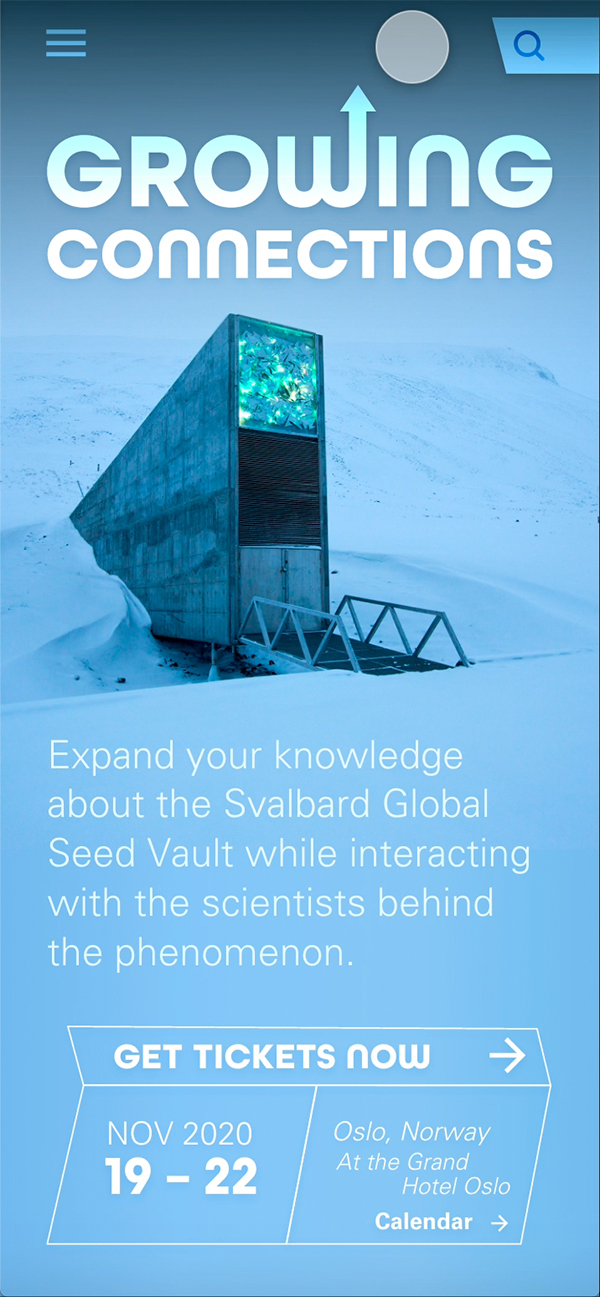
Pick an article from the provided list, read, and research. Collect content, organize into information architecture, create wireframes, and design an interface. Finally, prototype and record scrolling and interacting with the small website.

You are more than a number, but select something from your life to collect data about over the course of several weeks. Translate that data into an interactive infographic that reveals detailed layered information.
You’re hungry. Pull out your mobile device and order something. Translate the print version of your restaurant menu into a digital menu. Then prototype the experience of ordering yummy food and drink.
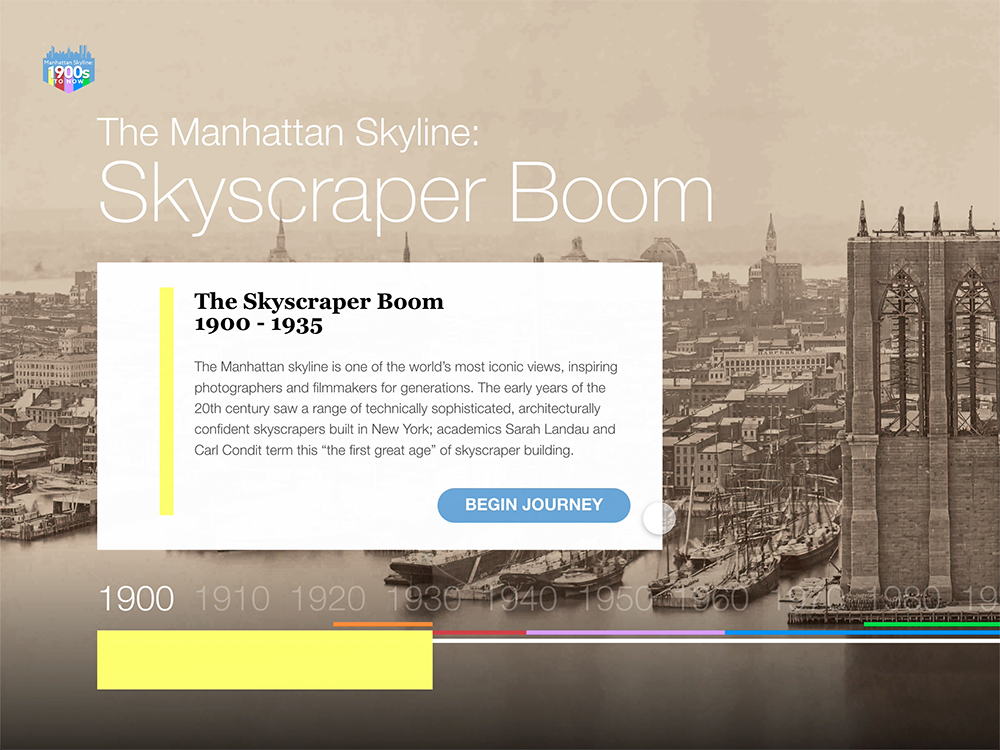
Research a topic, develop three user flows, and design an interface of an interactive timeline that the user would interact with while achieving their goals. Let’s interact with our history.
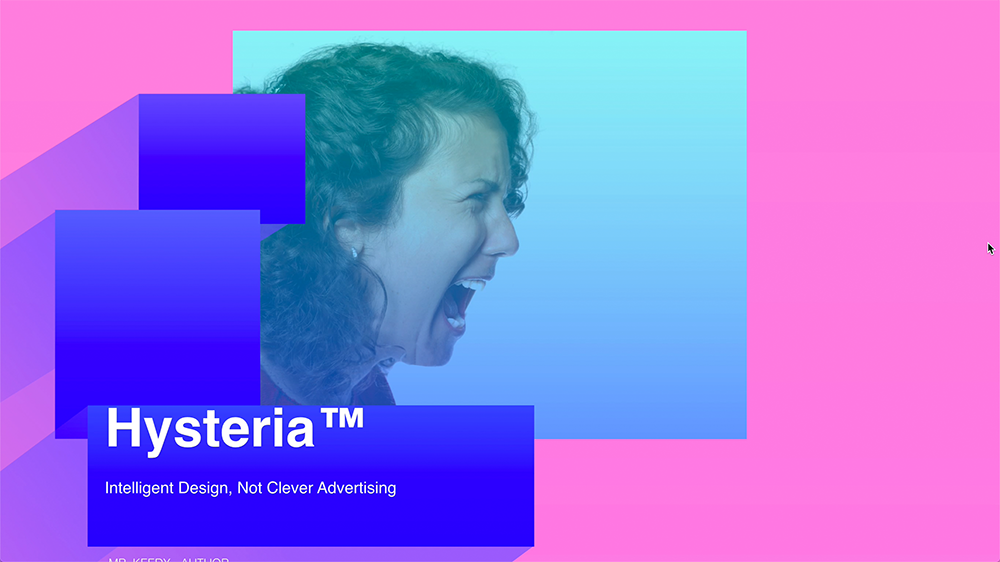
This is not your parents weblog. Read an article from the selected list and research to develop a type and image system. Design a longform webpage article that communicates the editorial message. 20-point body copy text? What the what? Check those type sizes, they’re not the same as print.
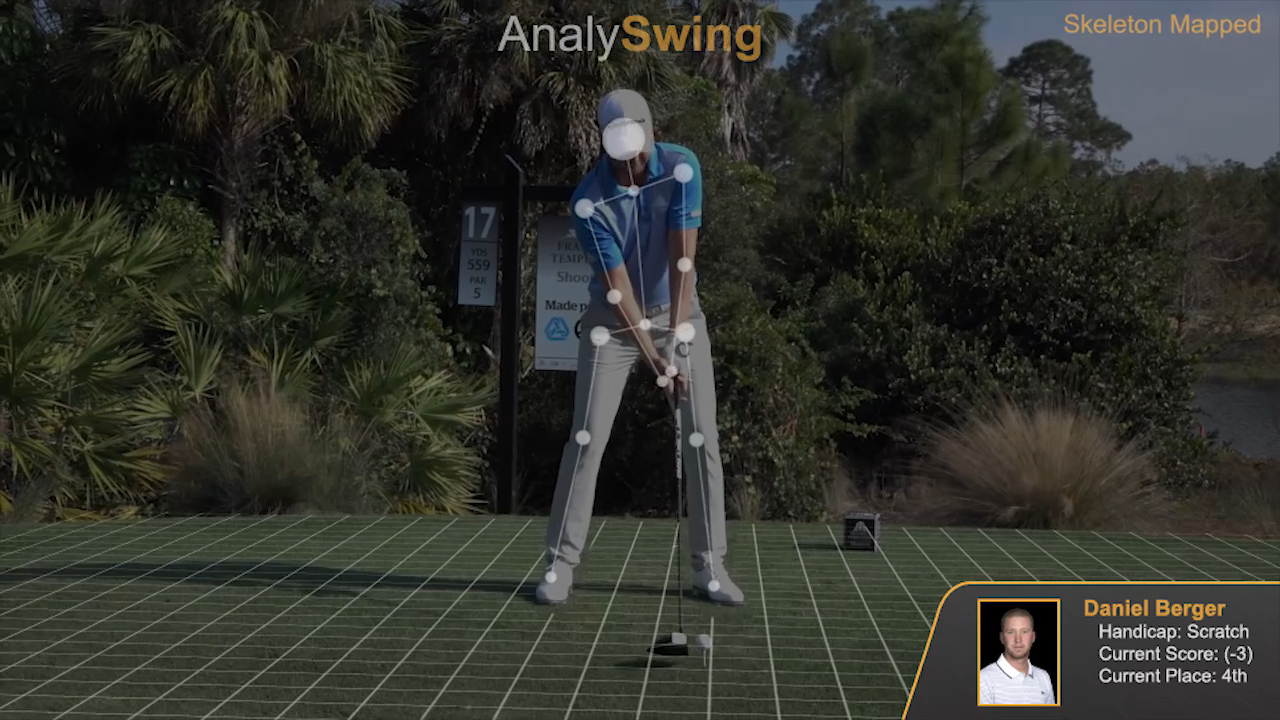
Research a topic, set user goals, develop user flow diagrams, design the interface, and prototype the user experience of an augmented reality app. Whew! Sit back with AR goggles on and let your eyes enjoy the layered content.
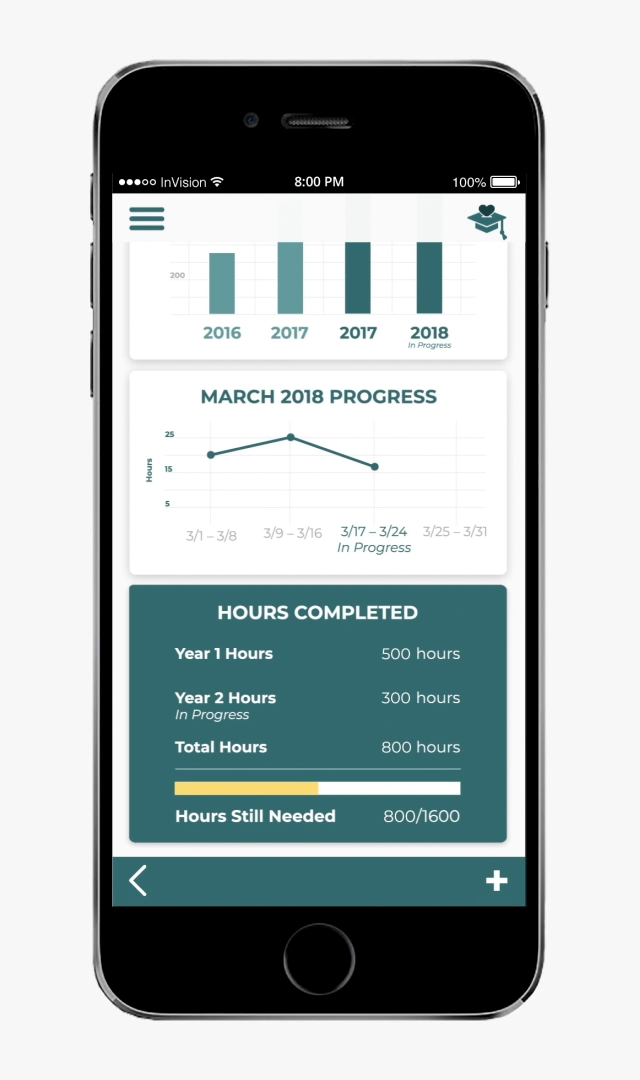
Fake it until you make it or prototype it until you develop it. Create a seamless user experience exemplified through a user flow in an interactive prototype for a digital product. Make it magical.