Research a topic of personal interest to collect quantitative data. Select the appropriate data visualizations and design the user interface. Finally, prototype the motion and micro-interactions to show and hide the layers of information.
/ / R3 _ Sult$
One-page Protest Website
Research five facts from a significant protest event in American history. Design a webpage section for each fact and create a fixed global navigation the links to each section on a one-page website.
George School website
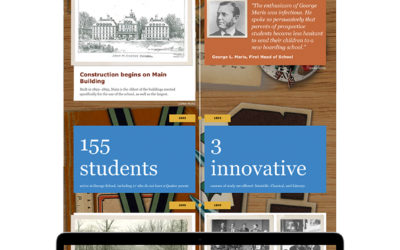
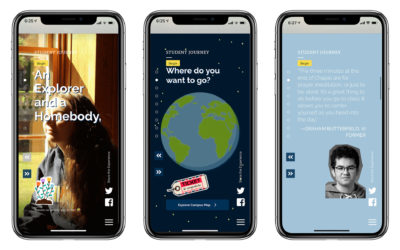
George School, located in Newtown, Pennsylvania, is a boarding school rooted in the Quaker tradition. As their primary international marketing tool, the school’s website needed…
John Jay Impact
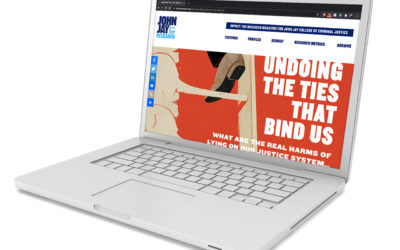
An annual report is powerful communication when it illuminates the impact of an organization, and John Jay College’s research magazine Impact is a good example. Once a traditional publication full of headshots, lists, and accolades, the college decided to…
Rensselaer Capital Campaign
Launching a capital campaign is an important undertaking for an institution, and it is imperative that the campaign communications be strategic and impactful. During our intake meeting, we discovered that the advancement team relied heavily on one-sheet communications delivered to prospective donors in a folder. We moved this important content to…
St. Mark’s Admission Campaign
What do a 14-year-old and 40-year-old have in common? Not much. Then why are enrollment communications created to speak to both segments simultaneously? Rethinking this traditional approach was the foundation for the…
Microsite
Pick an article from the provided list, read, and research. Collect content, organize into information architecture, create wireframes, and design…
Bio-Infographic
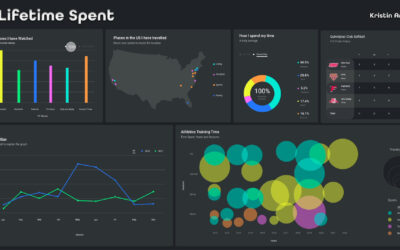
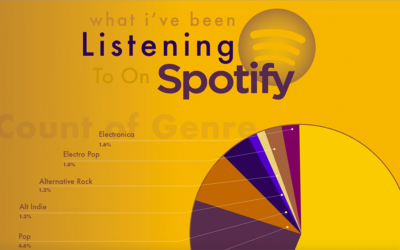
You are more than a number, but select something from your life to collect data about over the course of several weeks. Translate that data into an interactive infographic that reveals detailed layered information.
Tablet Restaurant Menu
You’re hungry. Pull out your mobile device and order something. Translate the print version of your restaurant menu into a…
Interactive Timeline
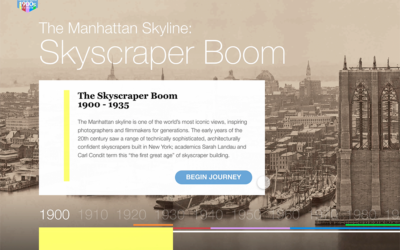
Research a topic, develop three user flows, and design an interface of an interactive timeline that the user would…
